List of green growth statistical indicators in Vietnam
What are the regulations on list of green growth statistical indicators in Vietnam? - Quang Vinh (Thai Binh)
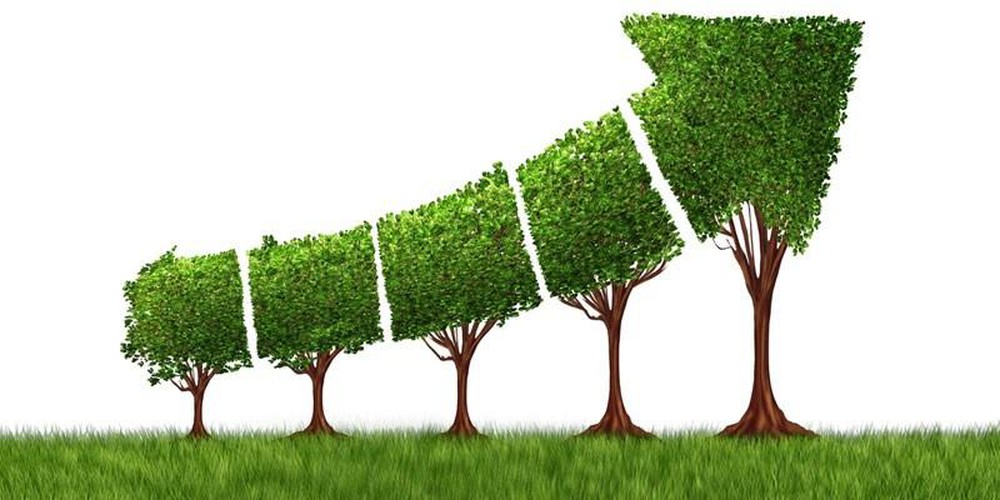
List of green growth statistical indicators in Vietnam (Internet image)
On November 1, 2023, the Minister of Planning and Investment issued Circular 10/2023/TT-BKHDT regulating the set of green growth statistical indicators.
List of green growth statistical indicators in Vietnam
Appendix I issued with Circular 10/2023/TT-BKHDT stipulates the list of green growth statistical indicators as follows:
|
No |
Code |
Corresponding national statistical indicator codes |
Objectives |
Implementation schedule |
Admisnistor |
Coordinating agency |
|
|
|
|
Objective 1: Reduce the intensity of greenhouse gas emissions per GDP |
|
|
|
|
01 |
1.1 |
|
Intensity of greenhouse gas emissions |
A |
Ministry of Natural Resources and Environment |
Ministry of Planning and Investment (General Statistics Office) |
|
02 |
1.2 |
|
Total greenhouse gas emissions |
A |
Ministry of Natural Resources and Environment |
Ministry of Industry and Trade, Ministry of Construction, Ministry of Transport, Ministry of Agriculture and Rural Development. |
|
|
|
|
Objective 2: Greening economic sectors |
|
|
|
|
|
|
|
I. Energy field |
|
|
|
|
03 |
2.1 |
|
Total primary energy supply/GDP |
A |
Ministry of Planning and Investment (General Statistics Office) |
Ministry of Industry and Trade; Ministry of Construction; The transportation; Ministry of Agriculture and Rural Development. |
|
04 |
2.2 |
|
Final energy consumption/GDP |
A |
Ministry of Planning and Investment (General Statistics Office) |
Ministry of Industry and Trade; Ministry of Construction; The transportation; Ministry of Agriculture and Rural Development. |
|
05 |
2.3 |
|
Proportion of renewable energy in total primary energy supply |
A |
Ministry of Planning and Investment (General Statistics Office) |
Ministry of Industry and Trade |
|
06 |
2.4 |
|
Ratio of electricity output from renewable energy to total electricity production |
A |
Ministry of Industry and Trade |
|
|
|
|
|
II. Transportation sector |
|
|
|
|
07 |
2.5 |
|
Percentage of buses using green energy compared to the total number of buses in circulation in special urban areas and class I urban areas |
A |
The transportation |
People's Committees of provinces and centrally run cities (special urban areas, class I urban areas) |
|
08 |
2.6 |
|
Percentage of new buses using green energy compared to the total number of new buses in special cities and class I cities |
A |
The transportation |
People's Committees of provinces and centrally run cities (special urban areas, class I urban areas) |
|
09 |
2.7 |
|
Percentage of road motor vehicles using green energy compared to the total number of road motor vehicles in circulation |
A |
The transportation |
|
|
10 |
2.8 |
|
Number of charging stations, number of electric vehicle charging ports |
A |
Ministry of Planning and Investment (General Statistics Office) |
Ministry of Industry and Trade, Ministry of Construction, Ministry of Transport, People's Committees of provinces and centrally run cities |
|
11 |
2.9 |
|
Ratio of added value of rail and waterway freight transport activities compared to the added value of freight transport |
A |
Ministry of Planning and Investment (General Statistics Office) |
|
|
12 |
2.10 |
|
Percentage of public passenger transport in special urban areas and class I urban areas |
B |
The transportation |
People's Committees of provinces and centrally run cities (special urban areas, class I urban areas) |
|
13 |
2.11 |
|
Ratio of length of highways, high-speed railways, urban railways to total length of roads and railways |
A |
The transportation |
People's Committees of provinces and centrally run cities |
|
|
|
|
III. Agriculture sector |
|
|
|
|
14 |
2.12 |
|
Average amount of chemical fertilizer used per hectare (1 ha) of cropland |
A |
Ministry of Agriculture and Rural Development |
|
|
15 |
2.13 |
|
Average amount of chemical pesticides used per hectare (1 ha) of cropland |
A |
Ministry of Agriculture and Rural Development |
|
|
16 |
2.14 |
|
Percentage of agricultural land area that is irrigated to save water |
A |
Ministry of Agriculture and Rural Development |
|
|
17 |
2.15 |
0814 |
Percentage of agricultural land area that is effective and sustainable |
A |
Ministry of Planning and Investment (General Statistics Office) |
|
|
18 |
2.16 |
|
The proportion of length of canals is solid |
A |
Ministry of Agriculture and Rural Development |
|
|
19 |
2.17 |
2105 |
Degraded land area |
A |
Ministry of Natural Resources and Environment |
|
|
20 |
2.18 |
|
Area of crops certified for good agricultural practices (VietGAP) and equivalent |
A |
Ministry of Agriculture and Rural Development |
|
|
21 |
2.19 |
|
Aquaculture area certified for good aquaculture practices (VietGAP) and equivalent |
A |
Ministry of Agriculture and Rural Development |
|
|
22 |
2.20 |
|
Percentage of agricultural product value produced according to good production processes (GAP) or equivalent |
A |
Ministry of Planning and Investment (General Statistics Office) |
Ministry of Agriculture and Rural Development |
|
23 |
2.21 |
|
Percentage of pig production facilities in the area treating waste with biogas or effective, clean treatment and use technology solutions |
A |
Ministry of Agriculture and Rural Development |
|
|
|
|
|
IV. Trade - service sector |
|
|
|
|
24 |
2.22 |
|
Contribution rate of tourism activities in GDP |
B |
Ministry of Planning and Investment (General Statistics Office) |
Ministry of Culture, Sports and Tourism |
|
25 |
2.23 |
|
Percentage of tourist destinations and tourism businesses labeled green |
B |
Ministry of Culture, Sports and Tourism |
Ministry of Planning and Investment (General Statistics Office) |
|
26 |
2.24 |
|
Percentage of facilities meeting green and sustainable medical facility standards compared to the total number of medical facilities |
B |
Ministry of Health |
Ministry of Planning and Investment (General Statistics Office) |
|
27 |
2.25 |
0517 |
Proportion of the added value of the digital economy in total domestic product |
A |
Ministry of Planning and Investment (General Statistics Office) |
Ministry of Information and Communications |
|
|
|
|
V. Technology field |
|
|
|
|
28 |
2.26 |
|
Percentage of businesses applying clean technology, advanced technology, high technology, and low carbon emissions in production |
B |
Science and technology |
|
|
|
|
|
BECAUSE. Field of investment capital, bonds, credit |
|
|
|
|
29 |
2.27 |
|
Ratio of green public investment capital compared to total public investment capital |
B |
Ministry of Planning and Investment (Department of National Economic Synthesis) |
|
|
30 |
2.28 |
|
Ratio of investment capital made for electricity production from renewable energy compared to investment capital made by the whole society |
A |
Ministry of Planning and Investment (General Statistics Office) |
Ministry of Industry and Trade |
|
31 |
2.29 |
|
Proportion of green credit balance in total credit balance of credit institutions and foreign bank branches |
B |
The bank of Viet Nam |
|
|
32 |
2.30 |
|
Proportion of green bond issuance in total issued bonds |
B |
The financial |
|
|
|
|
|
VII. Forest resources field |
|
|
|
|
33 |
2.31 |
2102 |
Forest cover rate |
A |
Ministry of Agriculture and Rural Development |
|
|
34 |
2.32 |
|
Percentage of area of natural wetland ecosystems and marine ecosystems restored |
B |
Ministry of Natural Resources and Environment |
|
|
35 |
2.33 |
|
Percentage of degraded natural forest ecosystem area restored |
B |
Ministry of Agriculture and Rural Development |
|
|
36 |
2.34 |
|
Percentage of production forest area certified for sustainable forest management |
A |
Ministry of Agriculture and Rural Development |
Ministry of Planning and Investment (General Statistics Office) |
|
|
|
|
VIII. Mineral resources sector |
|
|
|
|
37 |
2.35 |
|
Licensed, exploited and remaining mineral reserves are classified by reserve levels |
A |
Ministry of Natural Resources and Environment |
|
|
|
|
|
IX. Water resources sector |
|
|
|
|
38 |
2.36 |
|
Total surface water volume of main river basins |
A |
Ministry of Natural Resources and Environment |
|
|
39 |
2.37 |
|
Level of change in underground water level |
A |
Ministry of Natural Resources and Environment |
|
|
40 |
2.38 |
|
Level of change in total surface water volume of main river basins |
A |
Ministry of Natural Resources and Environment |
|
|
|
|
|
Objective 3: Greening lifestyles and promoting sustainable consumption |
|
|
|
|
|
|
|
I. Environment and society |
|
|
|
|
41 |
3.1 |
2107 |
Percentage of household solid waste collected and processed |
A |
Ministry of Natural Resources and Environment |
|
|
42 |
3.2 |
|
Percentage of household solid waste treated by direct burial method |
B |
Ministry of Natural Resources and Environment |
|
|
43 |
3.3 |
2106 |
Percentage of hazardous waste collected and treated |
A |
Ministry of Natural Resources and Environment |
Ministry of Industry and Trade; Ministry of Health (providing hazardous waste for the Health sector |
|
44 |
3.4 |
|
Percentage of urban wastewater collected and treated meeting environmental technical standards |
B |
Ministry of Construction |
Ministry of Natural Resources and Environment |
|
45 |
3.5 |
|
Percentage of communes meeting environmental criteria |
A |
Ministry of Agriculture and Rural Development |
|
|
46 |
3.6 |
2104 |
Number and area of nature reserves |
A |
Ministry of Natural Resources and Environment |
Ministry of Agriculture and Rural Development; People's Committees of provinces and centrally run cities |
|
|
|
|
II. Urban |
|
|
|
|
47 |
3.7 |
|
Area of public green land per capita in inner city and urban areas |
B |
Ministry of Construction |
Ministry of Planning and Investment (General Statistics Office) |
|
48 |
3.8 |
|
Percentage of urban areas meeting green growth urban standards towards smart, sustainable urban areas compared to the total number of urban areas |
B |
Ministry of Construction |
People's Committees of provinces and centrally run cities |
|
|
|
|
III. Government |
|
|
|
|
49 |
3.9 |
|
Ratio of green public investment expenditure compared to total state budget expenditure |
B |
Ministry of Planning and Investment (Department of Science, Education, Natural Resources and Environment) |
|
|
50 |
3.10 |
|
Ratio of green public procurement compared to total public procurement |
B |
Ministry of Planning and Investment (Procurement Management Department) |
|
|
51 |
3.11 |
|
Ratio of environmental protection spending compared to total state budget spending |
A |
The financial |
|
|
52 |
3.12 |
|
Proportion of environmental protection tax and natural resources tax in total state budget revenue, excluding revenues from housing, land and revenue from lottery activities |
A |
The financial |
|
|
53 |
3.13 |
|
Ratio of spending on environmental protection activities compared to GDP |
A |
Ministry of Natural Resources and Environment |
Ministry of Finance, Ministry of Planning and Investment (General Statistics Office) |
|
|
|
|
Objective 4: Greening the transition process on the principles of equality, inclusion, and enhancing resilience |
|
|
|
|
54 |
4.1 |
|
Proportion of days in the year when the concentration of substances in the air environment exceeds permissible technical regulations |
A |
Ministry of Natural Resources and Environment |
|
|
55 |
4.2 |
1806 |
Percentage of urban population supplied with clean water through centralized water supply systems |
A |
Ministry of Construction |
|
|
56 |
4.3 |
1807 |
Percentage of rural population using clean water that meets standards |
A |
Ministry of Agriculture and Rural Development |
Ministry of Planning and Investment (General Statistics Office) |
|
57 |
4.4 |
|
Percentage of household members who had enough drinking water in the past 12 months |
A |
Ministry of Planning and Investment (General Statistics Office) |
|
|
58 |
4.5 |
1809 |
Percentage of population using hygienic toilets |
A |
Ministry of Planning and Investment (General Statistics Office) |
|
|
59 |
4.6 |
1802 |
Multidimensional poverty rate |
A |
Ministry of Planning and Investment (General Statistics Office) |
|
|
60 |
4.7 |
|
Percentage of population living in temporary housing |
A |
Ministry of Planning and Investment (General Statistics Office) |
|
|
61 |
4.8 |
|
Equality index in education and training |
A |
Ministry of Education and Training |
Ministry of Planning and Investment (General Statistics Office) |
|
62 |
4.9 |
0713 |
Percentage of people participating in social insurance |
A |
Ministry of Planning and Investment (General Statistics Office) |
Vietnam Social Insurance (provides data on the number of people participating in social insurance) |
|
63 |
4.10 |
0714 |
Percentage of people participating in health insurance |
A |
Ministry of Planning and Investment (General Statistics Office) |
Vietnam Social Insurance (collects data on the number of people participating in health insurance) |
|
64 |
4.11 |
0715 |
Percentage of people participating in unemployment insurance |
A |
Ministry of Planning and Investment (General Statistics Office) |
Ministry of Labor, War Invalids and Social Affairs; Vietnam Social Insurance (provides data on the number of people participating in unemployment insurance) |
|
65 |
4.12 |
|
Total length of dikes |
A |
Ministry of Agriculture and Rural Development |
People's Committees of provinces and centrally run cities |
|
66 |
4.13 |
|
Number of embankments to prevent river and coastal erosion |
A |
Ministry of Agriculture and Rural Development |
People's Committees of provinces and centrally run cities |
|
67 |
4.14 |
|
Number of workers with green jobs in the economy |
B |
Ministry of Planning and Investment (General Statistics Office) |
|
|
68 |
4.15 |
1805 |
Inequality coefficient in income distribution (GINI coefficient) |
A |
Ministry of Planning and Investment (General Statistics Office) |
|
|
69 |
4.16 |
0209 |
Average income per working employee |
A |
Ministry of Planning and Investment (General Statistics Office) |
|
|
70 |
4.17 |
1801 |
Human Development Index (HDI) |
A |
Ministry of Planning and Investment (General Statistics Office) |
|
|
71 |
4.18 |
1607 |
Percentage of malnourished children under 5 years old |
A |
Ministry of Health |
|
|
72 |
4.19 |
|
Composite green growth index |
B |
Ministry of Planning and Investment (General Statistics Office) |
|
Note:
- Roadmap A: Applicable to targets that can be implemented as early as 2023 because there is already available information or information sources to calculate and synthesize.
- Roadmap B: Applicable to targets that cannot be implemented immediately because there is no information source or are being studied and are expected to be implemented from 2026.
- Green growth statistical indicators disaggregated by province and centrally run city (referred to as disaggregation by province level) are shown in Appendix II. The agency in charge of the target is responsible for assigning departments and branches under the People's Committee of the province and centrally run city to be the lead or coordinating agency in collecting and synthesizing each specific target.
More details can be found in Circular 10/2023/TT-BKHDT effective from December 15, 2023.
Ho Quoc Tuan
- Number of deputy directors of departments in Vietnam in accordance with Decree 45/2025/ND-CP
- Cases ineligible for pardon in Vietnam in 2025
- Decree 50/2025 amending Decree 151/2017 on the management of public assets in Vietnam
- Circular 07/2025 amending Circular 02/2022 on the Law on Environmental Protection in Vietnam
- Adjustment to the organizational structure of the Ministry of Health of Vietnam: Certain agencies are no longer listed in the organizational structure
- Vietnam aims to welcome 22-23 million international tourists in Vietnam in 2025
-
- Emergency response and search and rescue organizations ...
- 10:29, 11/09/2024
-

- Handling of the acceptance results of ministerial ...
- 09:30, 11/09/2024
-

- Guidance on unexploded ordnance investigation ...
- 18:30, 09/09/2024
-

- Sources of the National database on construction ...
- 16:37, 09/09/2024
-
- General regulations on the implementation of administrative ...
- 11:30, 09/09/2024
-

- Notable new policies of Vietnam effective as of ...
- 16:26, 11/04/2025
-
.Medium.png)
- Notable documents of Vietnam in the previous week ...
- 16:21, 11/04/2025
-
.Medium.png)
- Notable documents of Vietnam in the previous week ...
- 16:11, 02/04/2025
-
.Medium.png)
- Notable new policies of Vietnam to be effective ...
- 16:04, 02/04/2025
-
.Medium.png)
- Notable new policies of Vietnam effective from ...
- 14:51, 21/03/2025
 Article table of contents
