What are the guidelines for drawing and giving comments on geographical area charts in the Excel file? What are the basic objectives of the Geography subject in Vietnam?
What are the guidelines for drawing and giving comments on geographical area charts in the Excel file?
Guidelines for drawing and giving comments on geographical area charts in the Excel file Download
+ Overlapping area chart
+ Stacked from the origin chart
Students may refer to the following guidelines for drawing and giving comments on geographical area charts in the Excel file:
Guidelines for drawing geographical area charts
| Step 1: Analyze Data Tables and Construct Coordinate Systems Data analysis and processing: Check whether the data is in absolute values or percentages: If absolute values: Keep the data as is. If percentages: Ensure each year's total equals 100%. If not, adjust or recalculate. Do not arbitrarily change or rearrange the data order unless requested by the problem statement. Determine scale and paper size: Horizontal axis: Represents time (years), ensuring equal distances between the time nodes. Vertical axis: Represents the percentage (%) or absolute value, evenly divided from 0 to the maximum value (usually 100%). Attention to paper size: The chart frame is rectangular, with the height (vertical axis) about 2/3 the length (horizontal axis) to ensure aesthetics. Note: If the requirement is to represent the structure, structural transformation, convert the data to percentages before drawing. Mark the starting point (0) and important nodes clearly on the coordinate system. Step 2: Draw the Chart Construct a rectangle: Draw a rectangle to create the chart frame, ensuring balance between length and height. Horizontal axis: Represents the years, from the first year (left vertical axis) to the last year (right vertical axis). Vertical axis: Divide value nodes based on scale (e.g., 0, 10, 20,..., 100%) or absolute value (e.g., 0, 50, 100,...). Identify and draw the areas: In the case of multiple overlapping areas: Drawing order: Draw sequentially from bottom to top in the order of components (e.g., Agriculture, Industry, Services). Arrange components for easy observation, meaningful interpretation, and maintain aesthetics. Mark points: Mark each component's value for each year, then connect these points to create boundary lines between the areas. Color the areas: Use different colors for each area to clearly distinguish them. Colors should be harmonious and easily recognizable. Note on dimensions: Chart height represents units (percentage or value), chart width represents time. Step 3: Complete the Chart Record data: Note the data in the middle of each area, to help viewers easily recognize the specific value. Do not record like line charts (on data points). Annotations: Add a legend to explain the meaning of each color, area. Place the legend on the right corner or below the chart. Chart title: Clearly state the chart title, accurately reflecting the content, e.g.: "Area Chart Representing Vietnam's Economic Structure Through the Years (2000 - 2020)". Review: Ensure elements such as the coordinate system, colors, annotations, and chart title are complete and accurate. Common Mistakes When Drawing Area Charts Mistakes about axes and frames: Missing data at nodes on the vertical axis or origin (0). Wrong year spacing on the horizontal axis, uneven ratio on the vertical axis. Mistakes about the rectangle: Failure to create a balanced rectangle frame, missing units or scale. Mistakes about the areas: Incorrect order of drawing areas, inadequate coloring or aesthetically unpleasing coloring. Missing legend about the area colors. Mistakes about the chart title and legend: Missing chart title or title not accurately reflecting the content. Missing legend or incorrect annotation of color meanings. |
Guidelines for giving comments on geographical area charts
| - General comments on the entire data table: Observe, evaluate the general trends of the data. - Comment horizontally first: Over time, does factor a increase or decrease, how does it increase or decrease, by how much? Then factor b increases or decreases... factor c (magnitude difference) - Comment vertically: Which factor ranks first, second, third, and does its ranking change? - Summarize and explain. Observe general trends: Firstly, look at the entire chart to identify the main trends of components. Which component shows an upward, downward, or stable trend over the years. Example: "From 2000 to 2020, Vietnam's economic structure underwent significant shifts. The agricultural sector gradually decreased over the years, whereas the industrial and service sectors grew strongly. This indicates a transition from a traditional agricultural economy to a modern economy focused on industry and services." Summarize fluctuations: State the extent of fluctuations, whether large or small, of the components. Example: "Agriculture's proportion dramatically decreased from 60% to 20% over 20 years, a 40% drop. Conversely, industry rose from 20% to 40%, and services also rose from 20% to 40%, each increasing by 20%.". 2. Comment horizontally (over time) Analyze each factor: Compare the change of each component over the years, clearly stating the increase/decrease magnitude and rate of change. Example: "Agricultural sector: From 2000 to 2020, its proportion decreased from 60% to 40% (in 2010), further declining to 20% (in 2020). Total decrease of 40%, averaging a 2% decrease annually." "Industrial sector: Increased from 20% (in 2000) to 30% (in 2010) and continued to rise to 40% (in 2020). Total increase of 20% over 20 years, averaging a 1% increase annually." "Service sector: Increased from 20% (in 2000) to 30% (in 2010), then rose to 40% (in 2020). Total increase of 20% over 20 years, averaging a 1% increase annually." Calculate the discrepancy: Compare the increase/decrease between components to find which factor changed the most or the least. Example: "The agriculture sector experienced the largest decrease (40%), while industry and services had similar increases (20%)." |
*Note: Information is for reference purposes only./.
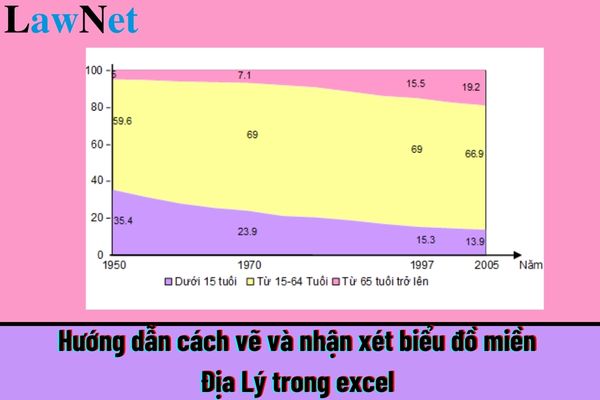
What are the guidelines for drawing and giving comments on geographical area charts in the Excel file? What are the basic objectives of the Geography subject in Vietnam? (Image from Internet)
What are the basic objectives of the Geography subject in Vietnam?
Under section 3 of the General Education Program for Geography promulgated by Circular 32/2018/TT-BGDDT, the basic objectives of the Geography subject are as follows:
- Based on fundamental knowledge and teaching methods that promote active, positive, and creative activities of students, the Geography curriculum helps students develop geographical competence - an expression of scientific competence;
- Additionally, along with other subjects and educational activities, it contributes:
+ To develop in students the key qualities and general capabilities that have been formed in the basic education stage, especially love for the homeland, and the country; the right attitude towards the natural and social environment; career orientation ability;
+ To form the character of citizens, ready to contribute to the career of building and protecting the Motherland.
What is the language used in the Geography subject in Vietnam?
According to Article 11 of the Education Law 2019 on the language used in the Geography subject:
- Vietnamese is the official language to be used in educational institutions. Based on the goals of education and specific requirements on educational contents, the Government shall stipulate the teaching and learning via foreign languages in educational institutions.
- The State shall encourage and enable ethnic minority people to learn their spoken and written languages as prescribed in Governmental regulations; hearing-impaired and speaking-impaired persons to learn via sign language, vision-impaired persons to learn via the Braille alphabet as prescribed in the Law on Persons with Disabilities 2010.
- Foreign languages defined in educational programmes are the languages used commonly in international communication. The teaching of foreign languages in educational institutions should guarantee that learners have continuing and effective learning process.